3.8 Molecular Biological Measures of Neuronal Activity: “CatFish”
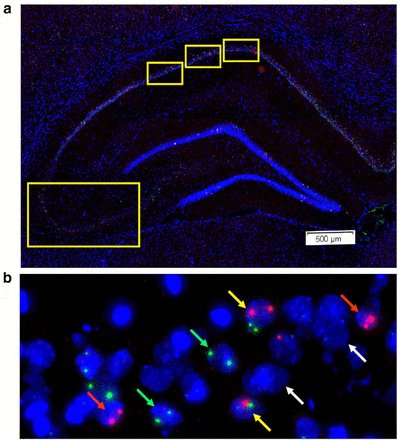
Although electrophysiological techniques allow researchers to examine the activity of neurons, it is often challenging to know a priori, which neurons will respond during a particular behaviour. At the cellular level, neuronal activity can now be visualized using compartment analysis of temporal activity by fluorescence in situ hybridization (catFISH), can map the distribution of neurons activated during two discrete behaviours by visualizing the sub-cellular localization of various immediate early gene (IEG) mRNA. The catFISH method examines the activity history of neurons at two different time points and estimates the numbers of neurons active based on the staining of particular IEG mRNAs during a distinct behavioural episode. This makes the technique similar to electrophysiological estimates under comparable conditions (i.e. before and after stimulation) and researchers typically measure “active” neurons by looking for the expression of c-fos or Arc mRNA before and after stimulation/behaviour etc.

References
From Acute Neuroinflammation Impairs Context Discrimination Memory and Disrupts Pattern Separation Processes in Hippocampus
Jennifer Czerniawski and John F. Guzowski
Journal of Neuroscience 10 September 2014, 34 (37) 12470-12480; DOI: https://doi.org/10.1523/JNEUROSCI.0542-14.2014
(cc by 4.0 by website to sFN 6 months after publication)
Front. Neurosci., 05 April 2011 | https://doi.org/10.3389/fnins.2011.00048
